Wondering how your total compensation package stacks up to other employers? Check out this report on total compensation, breaking down benefits and wages & salaries. .Using the National Compensation Survey’s Employer Costs for Employee Compensation (ECEC) report, which collects data from roughly 27,200 occupations and 6,600 private industries, Bay Alarm Medical breaks the information into a series of helpful charts and graphs that allow a snapshot view of the data: The True Cost of Employee Benefits
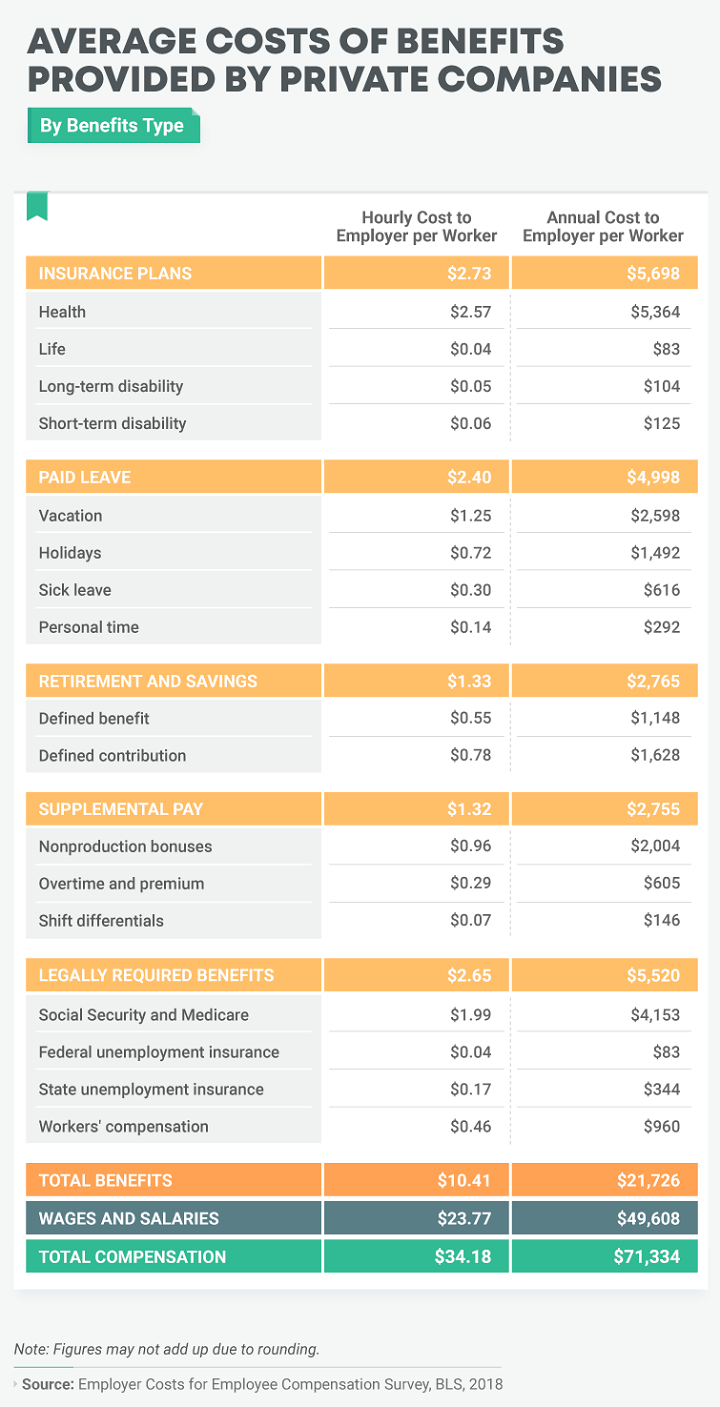
Their report says that benefits account for approximately 29% of an private industry employer’s compensation costs, with the remaining 70% representing wages and salaries. Average per employee benefits cost employers $21,726 annually. When wages and salaries are added, the total cost of compensation averages $71,334 per worker.
The charts break costs down costs of total compensation
- By percentage of the whole – health insurance is the big ticket item at 7.5% of the total
- By year and by hour – see chart, below
- By percentage of change from 2004 to 2018- over that time, there has been a 52% increase in total compensation, with a 368% benefit increase and a 164.6% increase in ages & salaries.
- Benefits per industry sector – with a high of the utility industry ($18.70 per hour.; $39,028 per year) vs a low of retail ($5,57 per hour; $11,625 per year)
- Costs in largest metropolitan areas – Phoenix AZ metro area has seen the steepest increase (89.8%) vs the lowest in Atlanta GA (1%)
- By company size – Predictably, larger employers spend more on benefits.
We can’t help but notice that Employee Assistance Programs are not measured – but we’d make the case that a substantial, high-performing EAP can be a highly economical way to beef up your benefits at minimal cost – see just a few of the employee benefits that ESI EAP brings to the table .